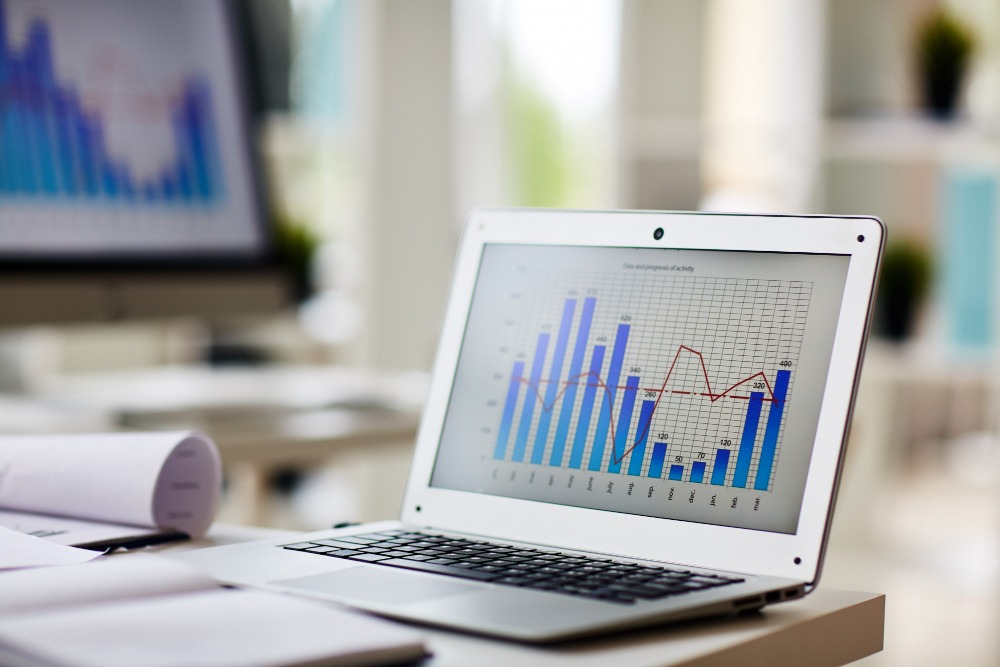
Transforming Small Business Decision-Making with Data Visualization
In today’s fast-paced business landscape, making informed decisions quickly can set your small business apart from the competition. A crucial tool that can facilitate this is data visualization. By turning raw data into visual insights, data visualization can dramatically enhance how you understand and utilize information, ultimately transforming your decision-making process. CodingHook shares more:
Understanding Data Visualization
Data visualization graphically represents information using charts, graphs, and maps, making trends, outliers, and patterns easier to understand. This approach simplifies complex data sets, aiding in interpretation and decision-making. Visuals translate vast amounts of data into more digestible forms, enabling quicker, more effective decisions. Additionally, interactive elements within these tools allow for deeper data exploration, offering a dynamic way to engage with and analyze your data. This enhances your ability to make informed decisions, ultimately improving business outcomes.
Presenting Data to Customers
You can use data visualization to present data to customers in an easy-to-digest way. You may consider this option for your marketing PDFs (e.g., posters, flyers, brochures) to enhance their appeal and effectiveness. These PDFs can be printed easily, retaining their professional formatting and providing customers with visually engaging, straightforward information. Visuals succinctly convey complex data, making it more accessible and compelling, enhancing customer engagement and understanding of your offerings and significantly improving customer interactions.
Improved Data Comprehension
Data visualization improves comprehension by making complex data sets accessible and transforming raw numbers into visual formats where patterns and trends become more apparent. This visual clarity helps you quickly grasp the essence of the data, leading to better, faster decision-making. Enhanced comprehension is crucial for small businesses, where time and accuracy are essential for competitiveness. Additionally, using colors, shapes, and interactive elements helps differentiate and highlight critical information, allowing you to focus on what matters most.
Enhanced Insights
The ability to visualize data leads to enhanced insights, providing a deeper understanding of your business operations. Visualization tools highlight relationships within the data that might not be obvious through traditional methods. These insights help uncover hidden opportunities, optimize processes, and improve business strategies. The enhanced perspective gained can guide you toward more strategic decisions. Additionally, visual analytics reveal trends over time, geographical patterns, and correlations between data sets, offering a holistic view of your business landscape.
Real-Time Monitoring
Real-time monitoring through data visualization allows you to track business metrics dynamically and respond promptly to changes. This immediate access to current data ensures you are always informed about performance, facilitating timely adjustments and preempting potential issues. Real-time alerts and notifications keep you updated on critical metrics, ensuring you never miss important developments. This capability is essential for maintaining optimal business operations, enhancing decision-making, and staying ahead of any challenges that may arise, ultimately leading to sustained business success.
Improved Forecasting
Data visualization improves forecasting accuracy by identifying patterns and trends in historical data. This helps you make better predictions about market trends, customer behaviors, and business outcomes. Accurate forecasts are essential for effective planning and resource allocation, ensuring your business can meet future demands. Additionally, visual forecasting models enable you to simulate various scenarios, preparing for different potential outcomes and developing more resilient business strategies. This approach enhances your ability to plan for and adapt to future challenges.
Identifying Bottlenecks
Identifying bottlenecks is a crucial benefit of data visualization. By mapping processes visually, you can easily spot inefficiencies or delays in operations. Recognizing these bottlenecks allows you to address them promptly, streamlining workflows and enhancing productivity. Efficient operations are crucial for small businesses to maximize resources and maintain smooth functions. Visualizing workflows helps understand the impact of specific bottlenecks on the overall process, enabling targeted interventions that significantly improve operational efficiency and effectiveness.
Data visualization is more than just a tool for making your data look good; it’s a transformative approach that can revolutionize how you make decisions. Embracing this technology can help you stay competitive, make informed decisions, and ultimately drive your business forward. With its ability to simplify complex data, improve understanding, and provide actionable insights, data visualization is an invaluable asset for any small business looking to thrive in a data-driven world.
Let’s get in touch
Get a risk-free, no obligation proposal in 1 business day or less.
